
How to Look Up Winnebago County Jail Population Data
Population data for Winnebago County is not a live dashboard. The county publishes a multi-year Average Daily Population chart on wincoil.gov titled Average Daily Population per Month/Year 1998 to Present Main Jail. That PDF is the primary local source for monthly and annual averages over time. The Sheriff's site supports the program detail with operational pages, contracts, and a procurement document for inmate health services that includes facility scope information.
For a name lookup, the right tool is the Sheriff's inmate inquiry, not the population page. Population data describes how many people are in custody on average; the inmate inquiry describes who is in custody right now. Individual-inmate name lookups belong on inmate records.
Source page: County-published Average Daily Population, Winnebago County Jail.
Winnebago County Jail Capacity Overview
Operational capacity figures for the Winnebago County Jail were not safely parsed from the harvested sources. The Criminal Justice Center is the main adult facility. The Juvenile Justice Center houses juvenile detention with a separate capacity. The Sheriff's jail page and corrections operations page describe the structure, services, and command. Capacity changes if a wing is closed for maintenance, a unit is reassigned, or staffing levels shift.
| Facility | Address | Custody Type |
|---|---|---|
| Winnebago County Jail / Criminal Justice Center | 650 W. State Street, Rockford, IL 61102 | Adult pretrial and sentenced custody. |
| Juvenile Justice Center | 211 S. Court Street, Rockford, IL 61101 | Juvenile detention; courtrooms 1, 2, 3 and probation. |
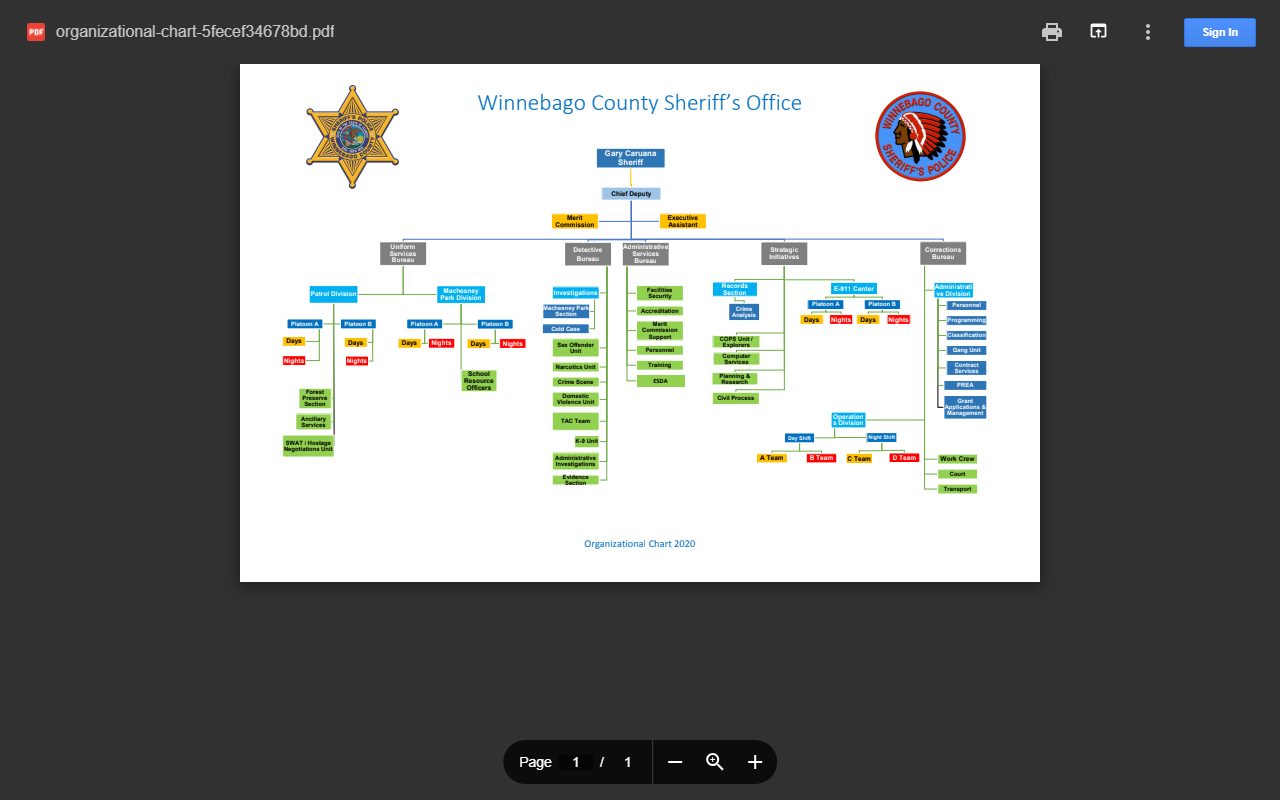
The Sheriff's organizational chart names Sheriff Gary Caruana and the command structure that supports both facilities. The chart sits on the official sheriff domain as a PDF.
Source page: Sheriff's Office organizational chart.
Average Daily Population at the Winnebago County Jail
The official county ADP chart covers the Winnebago County Main Jail from 1998 to present, on a monthly and annual basis. Direct numeric extraction requires parsing the official PDF; the wincoil.gov filename confirms the chart's existence. Standard practice is to take the most recent five complete calendar years, compute annual averages from monthly values, and read trend direction over time. Pandemic years likely depressed ADP; Illinois pretrial reforms under the SAFE-T Act changed money-bail practice in late 2023, which also affects local ADP.
ADP is a management number. It tells the sheriff and the county board how many beds, meals, and staff hours the jail typically uses on a given day, averaged over the period. It does not equal the maximum the jail can hold, the number of unique people booked, or the headcount on any single day. For year-over-year change, compare full calendar years rather than partial-year totals to avoid seasonal bias.
Note: Use the county PDF rather than third-party jail directories for any Winnebago County jail population data citation.
Demographic Context for Winnebago County Jail Population
County-level demographic breakdowns of the jail population were not found in the harvested sources. Detailed splits by race, age, sex, pretrial status, sentenced status, felony class, misdemeanor class, mental health needs, and medical needs require either a public records request or county research files. The Bureau of Justice Statistics publishes state-level and national estimates that provide context, and the Vera Institute publishes county-level incarceration trend data drawn from Annual Survey of Jails and other sources.
The Winnebago County resident base also matters for any rate calculation. The U.S. Census QuickFacts page for the county lists population, housing, age distribution, and other demographic detail. Dividing average daily population by resident population yields a per-capita rate that supports comparison to similar Illinois counties or to the national average for jails of similar size.
For a careful Winnebago County jail demographic lookup, the route is a FOIA request to Sheriff Records under 5 ILCS 140/3, supplemented by BJS state-level publications. Some records may be exempt under 5 ILCS 140/7 privacy and law-enforcement provisions.
Pretrial vs Sentenced Population in Winnebago County
The Winnebago County Jail holds both pretrial detainees and sentenced inmates. Pretrial detainees are awaiting bond, trial, or plea. Sentenced inmates are serving short jail terms or awaiting transfer to IDOC. The two groups are managed differently. Pretrial detainees have court dates set in the FullCourt portal. Sentenced inmates have IDOC pickup dates if state prison custody is next. Court Services moves both groups between the jail and the courtrooms.
| Population Type | Status | Typical Path |
|---|---|---|
| Pretrial detainee | Awaiting trial or bond | Court Services to courthouse for bond hearings, motions, trial. |
| Sentenced misdemeanor | Serving local term | Released at end of sentence or after credit; commissary returns to inmate. |
| Sentenced felony pending transfer | Waiting on IDOC pickup | Transfer to IDOC; commissary follows to state facility. |
| Federal hold | Held for federal authorities | Move to federal custody via U.S. Marshals; BOP after sentencing. |
Mental Health and Medical Population in Winnebago County Jail
The jail provides full medical and mental health care, which has direct consequences for population planning. University of Illinois College of Medicine at Rockford supplies around-the-clock medical, dental, and pharmaceutical care. Crusader Clinic partners on HIV services. Freedom Behavioral Health Services delivers behavioral health care through the Jail Behavioral Health System-Enhanced program, supported by the Winnebago County Community Mental Health Board and the half-cent sales tax. The procurement document on wincoil.gov for Inmate Health Care Services includes facility and capacity context tied to medical contracts.
Source page: County procurement for inmate health services.
Medical population needs drive cost. A jail with an average daily population that includes patients with chronic conditions, mental health diagnoses, or contagious diseases costs more per bed-day to operate. The Winnebago County mental health board funding is one of the levers that supports this part of the jail population. Treatment court participation also affects the population mix: Drug Court, TIP, Vet, and Family Drug Court tracks reduce reliance on traditional incarceration for eligible defendants.
State and National Context for Winnebago County Population
State and national context comes from the Bureau of Justice Statistics. BJS publishes the Annual Survey of Jails, the Jail Inmates report, and other periodic reports that include county-level estimates. These publications help compare Winnebago County to similar Illinois counties and to national averages. The Vera Institute publishes county-level incarceration trend dashboards drawn from BJS and other sources. The U.S. Census provides population data that lets analysts compute rates per 100,000.
Source page: U.S. Census QuickFacts for Winnebago County.
Note: Always pair a population number with a base population for context; a raw count does not tell the same story as a rate per 100,000 residents.
Population Trends and Operational Drivers
Several drivers shape Winnebago County jail population month to month. Court Services transports inmates daily; missed or delayed transports back up the bond docket. The SAFE-T Act eliminated cash bail in Illinois in September 2023, shifting pretrial release decisions to factors other than ability to pay. Treatment court participation diverts eligible defendants. IDOC transfer speed affects how long sentenced felons wait in the local jail. Federal holds add specific custody requirements that increase per-inmate cost.
Local advocacy and county budget processes also matter. Winnebago County's annual budget includes line items for sheriff operations, jail medical, behavioral health, and food service. Capacity expansion or contraction requires county board action. Court backlog from past years still affects pretrial population because cases held over from earlier dockets share calendar time with current filings.
Reentry programs and supervision quality affect downstream population too. A strong reentry path reduces return-to-custody rates. Goodwill Pathway Re-entry, Veterans Justice Outreach, and Rock Valley College education all reduce risk of repeat incarceration when participants complete the program. Sustained mental health linkage at discharge is a key factor for the share of the population that has behavioral health needs.
Looking Up a Specific Winnebago County Inmate by Name
This page covers population data. Individual-inmate name lookups belong on the inmate records page. The Sheriff's inmate inquiry is the official tool for a current-custody search by last name or letter group. The IDOC search covers state prison records. The BOP locator covers federal custody. The Circuit Clerk FullCourt portal covers court cases against the inmate.
Where Winnebago County Inmate Population Data Comes From
Two official Winnebago County sources matter most. The county-published ADP chart on wincoil.gov is the historical population record. The county procurement document for inmate health services on wincoil.gov is the facility-capacity context. The Sheriff's operations page documents medical, mental health, food, education, religious programming, and reentry programs. The Sheriff organizational chart names command staff. Together these four sources cover the jail population picture as published in official channels.
For broader context, BJS reports, Vera Institute county data, and Census QuickFacts provide the comparison framework. Never use a third-party jail directory as the citation source when an official county or Sheriff page covers the same data.
Cost and Service Context for Winnebago County Jail Population
The Winnebago County jail population is not just a headcount. Each person held in custody triggers a daily medical screening, a meal plan, a security shift, and a court-transport slot. The Sheriff's operations page documents around-the-clock medical care, behavioral health staffing, food service through Aramark, religious programming through Rockford Reachout Ministries, and education through Rock Valley College. Population fluctuations directly affect contract spending under each of these lines.
Note: A small change in average daily population can shift a large amount of county spending across medical, food, behavioral health, and transport contracts.
Research Gaps in Winnebago County Population Data
Several data points the public might expect were not safely parsed from the harvested official sources. These include current operational capacity by housing unit, juvenile detention capacity, demographic splits by race and age, average length of stay, and a current snapshot of pretrial vs sentenced ratios. Filling those gaps usually requires a FOIA request, a board agenda packet, or a researcher's PDF parse of the official ADP chart. Until those are completed, the safe move is to describe the framework without inventing numbers.
For court-side data that affects the population, see court records and court dockets. For the daily roster, see inmate records. For verified releases, see released inmates. For sheriff FOIA, see public records.